GEOTECHNICAL ENGINEERING1
LUTON
HomeGeophysicsElectrical resistivity / VES (Vertical Electrical Sounding)

Electrical Resistivity Testing (VES) in Luton: Subsurface Data for Smarter Ground Models

Rigorous testing. Clear reporting.

LEARN MORE

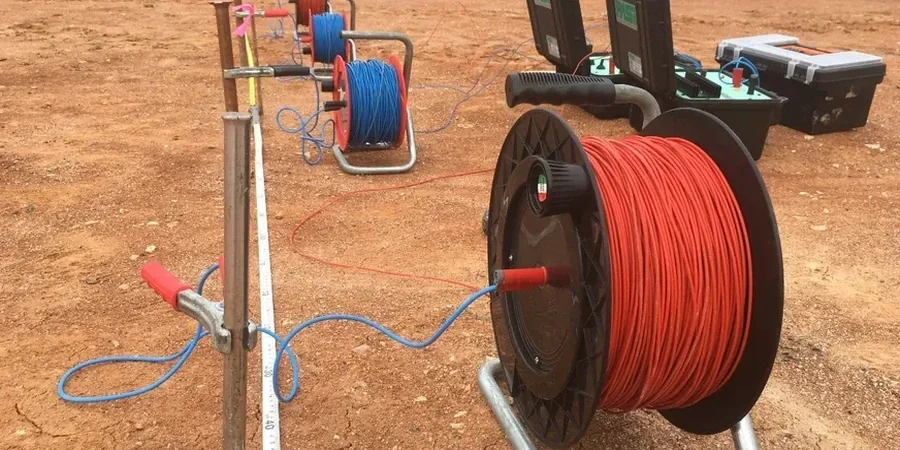
A contractor on Dunstable Road hit a buried chalk solution feature last March. Three days of delays while they figured out if the footing design still worked. The borehole log said one thing, the ground truth another. That gap between point data and the continuous subsurface picture is exactly why we run electrical resistivity surveys. A vertical electrical sounding array maps how resistivity changes with depth, flagging transitions from clay to chalk, pockets of saturated sand, or dissolution zones before the excavator bucket finds them. In Luton—a town shaped by the Cretaceous Chalk Group and capped with variable Quaternary deposits—geology can shift within a single site. The Lea Valley drift and Clay-with-Flints make for unpredictable interfaces. VES gives us a non-invasive cross-check, reducing the number of boreholes needed while tightening the ground model. Our team has applied this method on sites from the airport industrial corridor to the slopes near Wardown Park.

A resistivity profile costs a fraction of an extra borehole and catches lateral changes that point sampling simply cannot see.
Our service areas

Process and scope

A common mistake we see in Luton is assuming resistivity will be uniform across a site just because the first two soundings looked similar. Chalk saturation varies dramatically with fracture density and water table position. The River Lea’s tributaries create perched water tables in places you’d least expect. We run Schlumberger array configurations with expanding electrode spacing, pushing current deeper until we reach the required investigation depth—typically 20 to 40 metres for foundation studies. Each sounding produces an apparent resistivity curve that we invert with 1D layered models, often constrained by nearby borehole data or SPT drilling logs. The output is a geoelectric section showing true resistivity versus depth. We calibrate against local lithology logs to convert resistivity into engineering units. For karstic chalk, low resistivity zones can indicate clay-filled voids; high resistivity anomalies often mean massive, dry chalk suitable for end-bearing piles. In areas with made ground—common around the town centre redevelopment zones—we combine VES with CPT testing to separate fill thickness from natural strata. BS 5930:2015+A1:2020 guides our survey design, with electrode geometries tailored to expected layer contrasts.
Electrical Resistivity Testing (VES) in Luton: Subsurface Data for Smarter Ground Models
Technical reference — Luton

Local considerations

East Luton sits on the Chalk outcrop, but move west and you hit the Lambeth Group and London Clay. That boundary is not a clean line—transition zones create resistivity gradients that confuse uncalibrated inversions. Winter surveys in Luton carry their own risk: the top 30 centimetres of soil saturate after sustained rainfall, dropping surface resistivity and masking deeper signals. We compensate by adjusting electrode contact resistance with saline solutions and running reciprocity checks on every spread. Frozen ground is rare here, but wet chalk has a resistivity below 60 Ω·m, while dry chalk can exceed 200 Ω·m. Mistaking one for the other leads to wrong bearing capacity assumptions. Our inversion workflow incorporates lithological constraints from test pits in the same parcel, tying resistivity boundaries to observed strata changes. In karstic terrain near the airport, where dissolution pipes can punch through the chalk, we run orthogonal soundings to detect anisotropy—vertical pipes show as low-resistivity vertical features that a single sounding line would miss entirely.

Need a geotechnical assessment?

Reply within 24h.

Email: contact@geotechnical-engineering1.com

Video resource

Relevant standards

BS 5930:2015+A1:2020 – Code of practice for ground investigations, Eurocode 7 (BS EN 1997-2:2007) – Ground investigation and testing, BS EN ISO 22475-1:2021 – Geotechnical investigation, sampling and groundwater measurement, BS 1377 (relevant parts) – Soils for civil engineering purposes

Technical data

ParameterTypical value
MethodVertical Electrical Sounding (VES) – Schlumberger array
Investigation depth range2 m to 80 m (typical Luton projects: 15–40 m)
Measured parameterApparent resistivity (Ω·m), inverted to true layer resistivity
Electrode spacing (AB/2)1.5 m to 150 m, logarithmic progression
Data processing1D inversion with smoothness-constrained least-squares
Normative referenceBS 5930:2015+A1:2020, Eurocode 7 (BS EN 1997-2:2007)
ResolutionLayer thickness detection from ~10% of depth

Frequently asked questions

How deep can a VES survey investigate in the Luton chalk?

Practical investigation depth depends on the maximum electrode spread. With AB/2 reaching 150 metres, we can image resistivity down to roughly 80 metres in favourable conditions. For typical Luton foundation projects, we target 25 to 40 metres depth, which captures the full chalk weathering profile and the transition to competent rock. At sites with thick Clay-with-Flints cover, the high-resistivity surface layer can limit depth penetration; we adjust array geometry accordingly.

What does a resistivity survey cost for a standard site in Luton?

A typical VES campaign with four to six soundings across a residential or light commercial plot in Luton ranges from £560 to £720, depending on access conditions, required depth, and whether we provide joint inversion with other geophysical data. Sites with heavy vegetation, steep slopes, or restricted electrode layout may require additional setup time, which is reflected in the quote we provide after a desktop study.

Can resistivity testing replace boreholes on a Luton site?

No. VES complements boreholes—it does not replace them. Resistivity gives you continuous lateral coverage between point data sources. We always recommend at least one borehole or trial pit for lithological calibration, because resistivity is a proxy measurement. A low-resistivity zone could be saturated chalk, or it could be a sandy layer with saline groundwater. Only physical sampling confirms the material. The value is in reducing the number of boreholes needed and positioning them intelligently.

How do you calibrate resistivity data to local geology?

We use lithological logs from nearby boreholes, trial pits, or BGS mapping (1:50,000 Sheet 220, Leighton Buzzard and Luton) to assign resistivity ranges to known units. Where possible, we run a short calibration line directly next to an existing exposure or borehole. For chalk, we cross-reference resistivity against fracture logs and moisture content. The inversion software applies smoothness constraints that respect known layer boundaries, producing a geologically plausible model rather than a purely mathematical fit.

How long does a VES survey take on site?

A single VES sounding with a maximum AB/2 of 100 metres takes roughly 45 minutes to set up and measure, assuming good ground access. A full day on site typically yields six to eight soundings. Processing and interpretation add two to three working days, with the final report delivered as a PDF including apparent resistivity curves, inverted models, and a geoelectric cross-section tied to the site grid.

Location and service area

We serve projects in Luton and surrounding areas.

View larger map